Well, the entry on the Rose Bowl was so widely read and enjoyed so I thought I’d follow it up with an NFL version. This was all kicked off by my assertion that the NFL has become unwatchable product.
Disclaimer, due to a service interruption in my video, I missed the final one minute 31 seconds of game time, so it’s not quite the full game. Nevertheless, with 58 minutes and 29 seconds of playing time plus pre-game and half-time, it’s likely that the percentages hold for the entire broadcast. It was a mind-numbing 166 minutes of elapsed time with no aid of DVRs etc.
The game in question was the Indianapolis Colts vs. Kansas City Chiefs broadcast on NBC January 6, 2007. A word about the game, Indy has a defense? Apparently so. The Chiefs were held without a first down until late in the 3rd quarter. The Chiefs defense did well to hold the point total to 23, Indianapolis offense did enough to win, their defense performed very well. The Chief’s offense, well, was flat out offensive. It was one of the worst performances by an offense at any level I’ve witnessed. Indy won the game 23-8. For the record, I’m not a fan of either team.
A word about methodology and terms, I watched the entire available broadcast recording the number of ads (dedicated air time for a product/service/company >5 seconds) and the number of plugs (spots/mentions/images/product placement <5 seconds) with the advertiser name and a category. Additionally, due to the way NBC chose to present replays, there is a subcategory of plug called the fast plug where the image is a 1 second blast of logo plus sound. This is important because each replay was preceded and followed up by one of these fast plugs. The data was recorded in time sequence while watching the game and like the Rose Bowl, I've chunked it down and analyzed it to make it a bit more digestable.
This was the longest 2.75 hours of TV ever watched. Boring game, overload of ads, continuous flashing of brands. Ugh. Now on to the data.
The broadcast ran 166 minutes including pre-game and halftime. The game was supposed to start at 1:30pm PT according to the programming, but actually kicked off at 1:40 meaning there was 10 minutes of pre-game content/ads. There were 80 minutes of dedicated ad time in the programming, amounting to 48% ad time and 86 minutes of content accounting for the other 52% of programming. Within the 86 minutes of content time, there were 218 plugs (142 of which were “fast plugs”) – or a plug every 22 seconds. This is exclusive of the scoreboard crawler/ticker which was nearly continuously displayed with NBC and NFL logos.
Even backing out the fast plugs, the NBC logo with accompanying sound at the start and finish of each replay, there were 76 “regular” plugs in the 86 minute content time meaning there was a plug every 68 seconds. A total of 63 distinct advertisers paid for the ads, plugs, and fast plugs in this 166 minutes. Now wonder my brain was jello by the time this broadcast was completed.
The top 10 overall advertisers were:
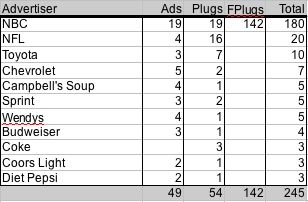
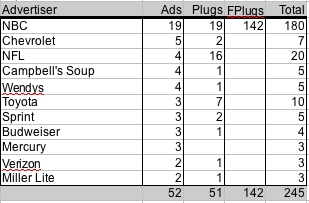
You can see that NBC (with or without the fast plugs) was the top advertiser. Interesting, I wonder if that’s by design entirely or if they were having difficulty selling ads? I doubt that it would have affected the plugs or fast plugs much, but having the broadcast network as the top overall advertiser seems odd, I’d think the spots would be worth more than the promotional value for new NBC shows and other sports events. The top Ad count and Plug count don’t look substantially different than the top 10 overall, here they are respectively starting with top ad count:
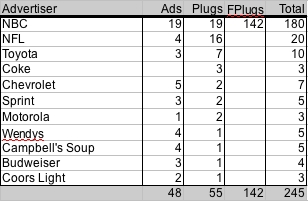
Top Plug Count:
As with the Rose Bowl analysis, I also dropped each ad/plug into a category. That shows another dimension of what’s being thrown at you when watching these games:
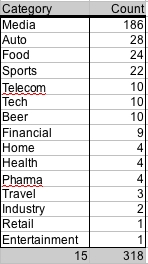
Setting aside the media category, there is much more balance in the categories for the NFL game than witnessed in the Rose Bowl. The media category still accounts for a 44 count when fast plugs are backed out making it the highest count category.
The roster of advertisers with counts follows:
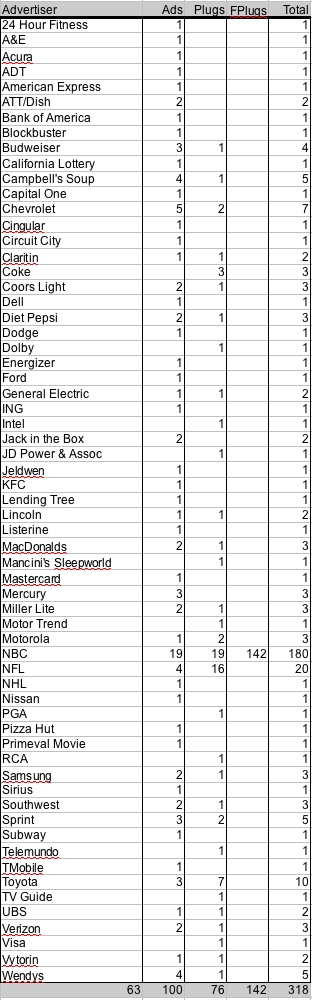
An interesting mix of companies with NBC properties leading all categories. There are a couple of advertisers in there I can only believe are local based on the San Francisco Bay Area broadcast area. The vast majority are national spots though I believe. Unlike the Rose Bowl, I can’t point to any particular ad that stood out in the neverending parade of advertisements. Perhaps the NFL contest commercial to go to the super bowl is the only exception, though I can’t remember what they wanted you to do to enter the contest.
As with the Rose Bowl, automobile/truck manufacturers dominated by quarter. Fords were one quarter, Chevy’s another, Toyota was halftime, Lincoln/Mercury another, and Nissan had a shot or two. There was less beer advertising that I expected in this particular broadcast. Beer and trucks were the advertising fuel driving games in my memory – they were there to be sure, just not in the proportions I would have expected.
Well, if you’re tired of watching sporting events because the ads have overpowered the content, you now have data. It’s nearly 50/50 content ads on traditional advertising fronts and when plugs and product placement are included, they get you even with DVR technology. I can’t ever imagine watching an NFL game other than perhaps the Superbowl as a social thing. I won’t ever watch another college football game without my trusty DVR. Even so, it’s clear advertising is evermore present in the content rather than being segregated into specific advertising slots. The one distinct advantage the NFL has over college is that the game pace does seem faster. I think that has to do with better officiating and clock rules.
I believe the data supports my earlier assertion that the NFL is unwatchable. That conclusion is subjective, but the data does demonstrate that the broadcast has become a long commercial with periodic breaks for the game.
If you liked this entry, Digg It!
OSU plays for the national championship TODAY!
Ohio State’s 2006 record: 12-0 Next up: Florida 1/8/2007
Tune: My Torture by Esthero
Technorati Tags: NFL | Advertising | Unwatchable | Mike Harding Blog
« Darwin Awards
» Montserrat Volcano erupts again
Business, Media
Ad Nauseum – NFL Playoff Ad Analysis
01.08.07 | 20 Comments


20 Comments
« Darwin Awards
» Montserrat Volcano erupts again
Musings from the Coast


comments
recent
- The Art of Being Cheap in Business
- The REAL Fiscal Cliff
- Plan for 2013
- Goodbye Gracie
- Our First Holiday Season as a Retailer
Categories
- Business (252)
- Coastal Stuff (124)
- Commentary (200)
- Energy (256)
- Humor (314)
- Innovation (277)
- Media (144)
- Oddyssea (52)
- Politics (245)
- Religion (80)
- Sports (170)
- Ohio State Football (136)
- Technology & Science (162)
- Travel (106)
Links
- Buckeye View
- Coastsider
- Freedom From Religion Foundation
- Half Moon Bay Buoy
- Half Moon Bay Review
- Information Arbitrage
- Loud Thoughts
- Oddyssea
- Stephen Years dot Com
I usually watch NFL games with Tivo using the 1st and second FF speeds. The whole score-commercial-kickoff-commercial thing kills me.
I’d say at least use a Tivo, you’re still getting a fair number of ads though. Did it surprise you that nearly 50% was dedicated ad time?
You did it again! And without pepper-coated lancets in your eyes. Cheers.
Great work and very interesting. That’s why most of us have become master clicker operators. I usually watch a couple of games at a time, plus some inane syndicated sit-com just to keep from going crazy. If it’s this bad during a wildcard game, what must the Super Bowl be like. Maybe we don’t want to know.
Yeah, last time for this. Maybe I’ll build up enough resistance to try again next season. But I’m hanging them up for the foreseeable future.
Drew, you must be the master of continuous partial attention! I can juggle two threads, but a couple of games and a sitcom would send me over the edge. I’m sure there’s some sort of university study on how much ad exposure one gets when mult-viewing like this. That’d be interesting. I won’t do it though!
Nice work. This is why I try to wait until the last hour of the game to turn it on; it’s just getting ridiculous by now.
Ah, but at least in the Superbowl the commercials can be entertaining. It’s the one time my wife want to see the commercials (she couldn’t care less about the game). The ads are almost always better than the halftime show. Halftime shows with nudity are still the best, so maybe USC can help.
Yeah, a DVR with fast forward is the way to go. I estimate you could watch the game in a little under the content time, so instead of a 3 hour investment, you could get it down to 1:20 or so. Good strategy.
Kevin, alas, not every game has the clever ads of the superbowl…and I do have to say now that I’ve watched two games like this, I mind the actual dedicated ads less than the constant plug-o-rama in the content time.
Great post. I’m a huge Eagles fan and completely agree that the NFL has become unwatchable due to constant commercial breaks (and the plugs, as you point out). My solution: Soccer. No commercial breaks at all. No ads other than the ones along the sideline boards and on the jerseys. Games usually start and finish in exactly 2 hours.
Perhaps I’ll try soccer out. I’ve watched some world cup and general premiership games while in England, but I’m not sure it’s my cup of tea. It’s worth another try though I suppose.
It’s that commercial break after a kickoff they added a few years ago that really made games unwatchable for me. That and the replay challenge breaks. I taped the Monday night Bears-Cardinals games this year and couldn’t believe how much fastforwarding was necessary to just watch the freaking game
You said it Bud. It reached the tipping point of watchability. They say the game is free to watch, but it’s not really.
I wouldn’t say NBC having the most ads is all that farfetched. The reason why networks buy the rights to televise NFL games is to promote its own shows during the broadcasts. They can’t make up all the money they spent from ad revenue, but they can hope that people see NBC promos and watch those shows so that they get increased ratings for their primetime lineup and make money off of their own shows.
Fair point on NBC, it’s just that given a choice between cash and longer term gain, I typically see publicly traded companies take the cash.
Great read.
I was wondering if you could do something that breaks down the amount of actual GAME-ACTION that takes place during a football game.
With play clocks and all that garbage…there’s probably like 8 minutes of actual action in a football game.
I’m just glad that otherwise devoted NFL fans are sickened with the unwatchable product like I am.
[…] Last week you read about the tonnage of ads ABC subjected you to during the Rose Bowl. Well, Mike Harding subjected himself to the horror again and documented advertising spots during last weekend’s Colts-Chiefs game. […]
[…] I’ve done an analysis of a playoff game, it’s certainly worse than expected. Take a look at the findings… I recognize that football, particularly the National Football League (NFL,) is a for profit […]
[…] I haven’t watched a single minute of NFL football. Why you ask? Because it’s an unwatchable product for one, I have a real life to live, and there are a few other things we might be paying attention to; at […]