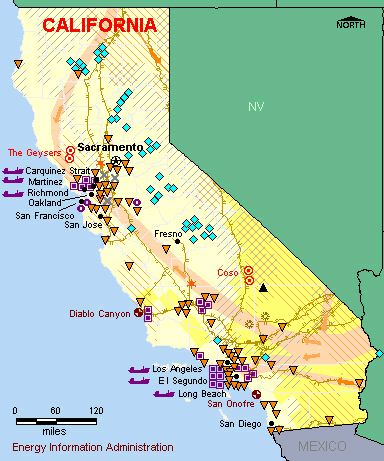
The Energy Information Administration (part of DoE) has launched a new website that provides a comprehensive overview of energy consumption, production, and distribution across the US, with deep dives into each state. It’s pretty cool (though there is room for improvement as the Imperial Valley in California is missing as a geothermal producer for example.) It seems to use much of the same data from the Electric Power Monthly report and much more aggregating it into a more consumable format. It’s certainly a great start.
When clicking around a bit, one of the things that struck me was that California, with 12% of the US population is responsible for only 2.2% of carbon dioxide and nitrogen dioxide emissions and 0.2% of sulphur dioxide emissions in the US. While the share was wildly disproporitionate, the absolute tonnage of emission is still enormous. The image below shows a summary of California, click the picture to get the detail that goes along with the image.

21 days until OSU plays for the national championship
Ohio State’s 2006 record: 12-0 Next up: Florida 1/8/2007
Tune: Rivers of Babylon by Sublime
Technorati Tags: Energy | Reports | DOE | Mike Harding Blog
« More Geysers development
» Unwatchable
Energy
Cool new DoE resource
12.18.06 | Comment?
« More Geysers development
» Unwatchable


