Data based on Electric Power Monthly Report
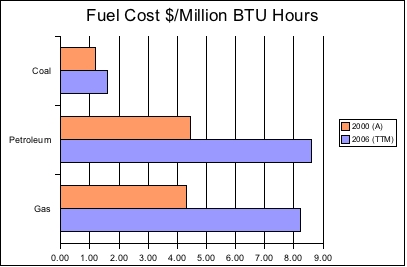
As you can see from the graph above, fuel prices have increased rather dramatically for petroleum and natural gas over the past 6 years. It is worth noting that the 2000 numbers are actual average prices (A) and the 2006 numbers are a trailing twelve month average (TTM.) Even coal, not known for price volatility has increased in price 35% during this time period. Petroleum and gas have increased 95% and 91% respectively in the same time period. As previously noted in this entry, coal, petroleum, and gas accounted for 72% of electric power generation in 2005 with coal accounting for the large majority of generation. Gas accounts for 19% of total generation, up 84% from 1992. Petroleum accounts for 3% of generation.
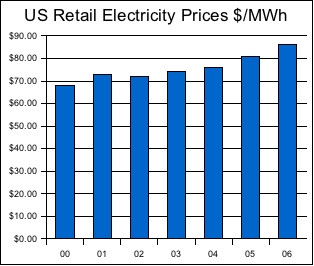
A fair question would be, what has happened to retail prices of electricity during this same period?

Data based on Electric Power Monthly Report
As you can see, retail prices have increased during this same time period, but not close to the rate of increase of fossil fuel cost. Does this mean electric generation companies are going out of business? Rising costs without a commensurate increase in end product cost tends to affect profit in a negative way. One thing is certain, it will be challenging to maintain a competitive business model when fuel costs are a major component of the cost of goods sold. Couple that with increasing regulatory pressures over emissions from oxidizing such fuels setup an interesting challenge for the power generation industry.
Ohio State’s 2006 record: 6-0 Next up: @Michigan State 10/14
Tune: Another Brick in The Wall (II) by Pink Floyd
Technorati Tags: Electricity | Fossil Fuel | Energy Cost | Mike Harding Blog
« 480 million reasons to take a risk
» 655,000 dead
Energy
Fossil fuel costs for electric generation
10.10.06 | 1 Comment
1 Comment
« 480 million reasons to take a risk
» 655,000 dead


[…] In previous entries we’ve discussed how much electricity the US is producing and consuming, what the sources of generation are, and how much it costs from a monetary perspective. But there are other costs. This entry will focus on the largest fuel source for electricity generation, coal. This is an ancient source that is well understood and drives a massive supply chain from real estate with mineral rights clear through mining and transportation and finally ending up in places like electricity generation. Without a doubt the technology for oxidizing (burning) coal to create heat which in turn is transferred to liquids which through phase change from liquid to gas pressurize and then drive turbines attached to generators, has improved dramatically. Back during the early days of the industrial revolution cities like Pittsburgh were covered in smog and soot. The state of the art today is that approximately 1,000 kg (~2,200 lbs) of carbon dioxide and approximately 13kg of sulfur dioxide and nitrogen oxides are emitted into the atmosphere for each MWh of power generated by burning coal. As is well known, carbon dioxide is a major contributor to global warming and the sulfur and nitrogen oxides are key ingredients to acid rain. This level of emissions is a vast improvement from the late 19th century, but still constitutes a problem. With 5% of the population of the earth, the US is responsible for 23% of carbon dioxide emissions on the planet (not just electricity generation, transportation has alot to do with that number as well.) (Source: US Environmental Protection Agency.) One of the key challenges in limiting emissions is the increasing demand for electricity. Right now, the demand is outstripping the new cleaner generation technology’s installation rate which means that older, less efficient, more polluting coal generation plants are staying in production longer than is desirable. Each time a new technology (be it natural gas or photovoltaics) is deployed, it either meets new demand or displaces older, less cost effective generation technologies. Given the increasing cost of fossil fuels, there is an opportunity to focus our attention more completely on the installation of renewable electric generation at a scale that makes the economics attractive in addition to exceeding the growth in electricity demand. That could have the effect of displacing less effective generation technologies and as a side effect, limit harmful emissions. Ohio State’s 2006 record: 6-0 Next up: @Michigan State 10/14 Tune: Use me by Bill Withers Technorati Tags: Energy | Pollution | Emissions | Mike Harding Blog […]