Do you think, over the next 10 years, that US electricity consumption will increase or decrease?
An interesting question, there are constant conservation programs and there is ever improving technology (like Sun’s Ultra T1 processor,) but do you think that’s enough to offset any increase in demand?
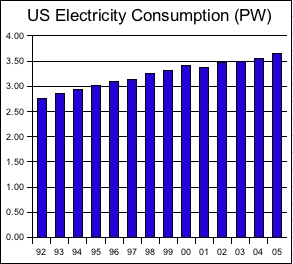
Sometimes a historical look can be illuminating when attempting to answer these sorts of questions. The chart below shows in Petawatt hours (a petawatt is 1,000,000,000,000,000 watts) how electricity production has grown since 1992 in the US. For our international readers, I apologize, I’m not taking a global position on this, only a US-centric position. Well, frankly, because I live here and it’s big enough to be undigestable with the US alone. Notice that there is an aggregate increase of nearly a petawatt hour in the amount of electricity consumed over the past 13 years.

Data based on Electric Power Monthly Report
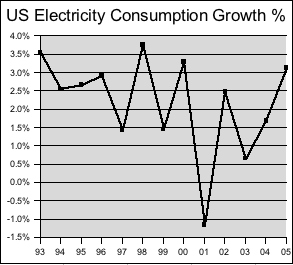
A percentage view of electricity consumption over time shows the growth is assuredly not linear. From 1992 to 2005 the aggregate growth in electricity consumption is 32.4%. There does seem to be a correlation between electricity consumption and the overall health of the economy. Note the relatively high growth rate in 1999 (Dotcom bubble) and the negative growth rate in 2001 (post bubble, 9/11) – both of these years vary considerably from the average annual growth rate of 2.2%. It is also interesting to note that the growth rate in 2005 is 3.1%, the fourth highest percentage in the measurement period. Which begs the question, are we in the midst of another bubble?

Data based on Electric Power Monthly Report
Returning to the questions above, will demand for electricity increase or decrease and what, if any impact with conservation and technology have on the trend? I believe we’ll continue to see an increase in demand. Even a fraction of a % of growth in demand spurs the need for more energy generation. And that’s interesting.
Meatspace coordinates: N37.324 W122.309
Ohio State’s 2006 record: 5-0 Next up: Bowling Green 10/7
Tune: Blues Power (Live) by Albert King
Technorati Tags: Electricity | Consumption | Energy | Mike Harding Blog
« Let’s watch this election closely
» OSU/BGSU Preview
Energy, Innovation
US Electricity Consumption
10.06.06 | 8 Comments
8 Comments
« Let’s watch this election closely
» OSU/BGSU Preview


[…] In previous entries we’ve discussed how much electricity the US is producing and consuming, what the sources of generation are, and how much it costs from a monetary perspective. But there are other costs. This entry will focus on the largest fuel source for electricity generation, coal. This is an ancient source that is well understood and drives a massive supply chain from real estate with mineral rights clear through mining and transportation and finally ending up in places like electricity generation. Without a doubt the technology for oxidizing (burning) coal to create heat which in turn is transferred to liquids which through phase change from liquid to gas pressurize and then drive turbines attached to generators, has improved dramatically. Back during the early days of the industrial revolution cities like Pittsburgh were covered in smog and soot. The state of the art today is that approximately 1,000 kg (~2,200 lbs) of carbon dioxide and approximately 13kg of sulfur dioxide and nitrogen oxides are emitted into the atmosphere for each MWh of power generated by burning coal. As is well known, carbon dioxide is a major contributor to global warming and the sulfur and nitrogen oxides are key ingredients to acid rain. This level of emissions is a vast improvement from the late 19th century, but still constitutes a problem. With 5% of the population of the earth, the US is responsible for 23% of carbon dioxide emissions on the planet (not just electricity generation, transportation has alot to do with that number as well.) (Source: US Environmental Protection Agency.) One of the key challenges in limiting emissions is the increasing demand for electricity. Right now, the demand is outstripping the new cleaner generation technology’s installation rate which means that older, less efficient, more polluting coal generation plants are staying in production longer than is desirable. Each time a new technology (be it natural gas or photovoltaics) is deployed, it either meets new demand or displaces older, less cost effective generation technologies. Given the increasing cost of fossil fuels, there is an opportunity to focus our attention more completely on the installation of renewable electric generation at a scale that makes the economics attractive in addition to exceeding the growth in electricity demand. That could have the effect of displacing less effective generation technologies and as a side effect, limit harmful emissions. Ohio State’s 2006 record: 6-0 Next up: @Michigan State 10/14 Tune: Use me by Bill Withers Technorati Tags: Energy | Pollution | Emissions | Mike Harding Blog […]
Where can I find out how much national US power is used by all “instant on” devices? It seems like Western Europe doesn’t use “instant on”.
Hi Pete,
No, I don’t know of a source. However, I have seen estimates that the “vampire load” which includes instant-on devices accounts for 5-10% of demand. In my own home, it was 9.8% before addressing the issue, now doing everything I can think of to minimize it, it’s a little over 3%.
Good luck!
[…] and trivial buffs the next levels upward are giga, tera, peta, exa.) For principals of scale, the entire US power supply is around 4 petawatts, up from 2.7 PW in […]
I think you meant terawatt-hours, not petawatt-hours.
Scratch that. My bad.
uhhhhhhhhhhhhhhhhh……..
If most people won’t do an easy thing, like turning off a TV when they’re not using it, how can we expect them to do things that actually require a tiny amount of effort?