ITAIPU: 63.3 GWh and zero emissions
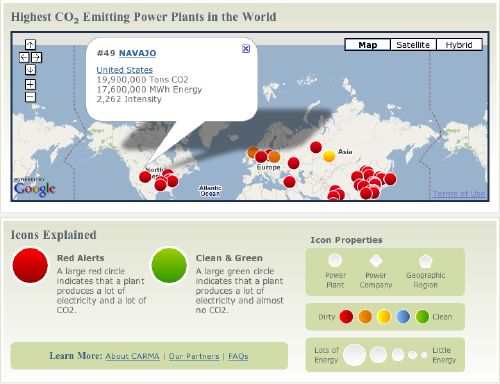
A few days ago the link for Carbon Monitoring for Action (CARMA) was forwarded along to us. This is a mashup of the global electric power plant database on a map with visual representation of the size of the plant, intensity, and carbon contribution plotted on the map, globally, by continent, by country, by region/state, etc. Take a look at a screen shot below:

As you can see, the top 50 carbon emitters are plotted at a global level and #49 Navajo Power Plant is selected showing it produces 17.6 GWh of power along with 19.9 M tons of CO2 emissions per year. One of the more interesting things they track is intensity, or pounds of CO2 emitted per megawatt-hour of electricity produced.
The data in CARMA are compiled from numerous sources. Emissions data for thousands of power plants in the U.S., Canada, the EU, and India come from official reports. Other data are derived from information provided by power sector analysts, the International Energy Agency, the U.S. Department of Energy, the Environmental Protection Agency, and a host of geographic databases. So while it might not be 100% accurate, it’s credible and trackable and certainly better than what existed before.

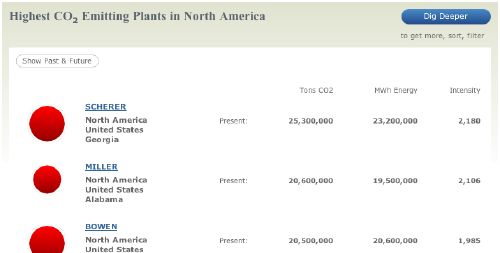
The aggregations and zooming are very useful and it enables a researcher to determine not only the largest contributors to CO2 emissions, but also the most intense (or least efficient) as well as the lowest producers and most efficient power plants. One thing that may be surprising to people is that the largest electric power plants on the planet are also among the lowest CO2 emitters – gravity hyrdo-generation facilities. For instance, the largest plant on the planet is ITAIPU in Brazil, an 8 GW hydo facility producing over 63 GWh of power per year and zero CO2. In fact, of the 15 largest power plants globally (4 GW and over) – ten are zero CO2 emission.
If you’re interested in knowing more about power plants, their emissions, and impact, we encourage you to visit CARMA.


