That is the number of Iraqi’s killed in this war. Here’s the article.
Saddam may have been a bad guy, but the mortality rate was 5.5 per 1000 when he was the oppressor. It’s now 13.3 per 1000. This does not appear to be progress…..and now takes the mystery out of why so many people there are willing to take up arms against their oppressors. What have they got to lose?
There is not a good ending to this situation. For anyone. As I said in an earlier entry, vote for the challenger. Let’s throw the bums out.
Ohio State’s 2006 record: 6-0 Next up: @Michigan State 10/14
Tune: Highway to Hell by AC/DC
Technorati Tags: Iraq | Death | War | Mike Harding Blog
Commentary
655,000 dead
Energy
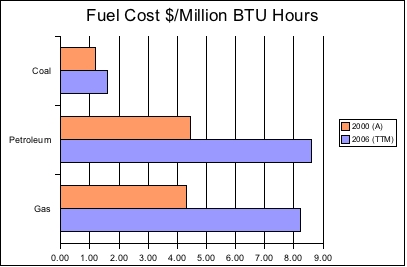
Fossil fuel costs for electric generation

Data based on Electric Power Monthly Report
As you can see from the graph above, fuel prices have increased rather dramatically for petroleum and natural gas over the past 6 years. It is worth noting that the 2000 numbers are actual average prices (A) and the 2006 numbers are a trailing twelve month average (TTM.) Even coal, not known for price volatility has increased in price 35% during this time period. Petroleum and gas have increased 95% and 91% respectively in the same time period. As previously noted in this entry, coal, petroleum, and gas accounted for 72% of electric power generation in 2005 with coal accounting for the large majority of generation. Gas accounts for 19% of total generation, up 84% from 1992. Petroleum accounts for 3% of generation.
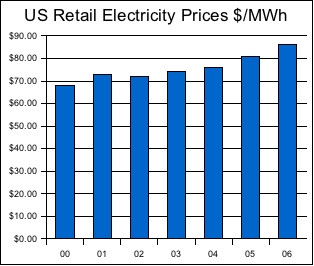
A fair question would be, what has happened to retail prices of electricity during this same period?

Data based on Electric Power Monthly Report
As you can see, retail prices have increased during this same time period, but not close to the rate of increase of fossil fuel cost. Does this mean electric generation companies are going out of business? Rising costs without a commensurate increase in end product cost tends to affect profit in a negative way. One thing is certain, it will be challenging to maintain a competitive business model when fuel costs are a major component of the cost of goods sold. Couple that with increasing regulatory pressures over emissions from oxidizing such fuels setup an interesting challenge for the power generation industry.
Ohio State’s 2006 record: 6-0 Next up: @Michigan State 10/14
Tune: Another Brick in The Wall (II) by Pink Floyd
Technorati Tags: Electricity | Fossil Fuel | Energy Cost | Mike Harding Blog
Innovation
480 million reasons to take a risk
Earlier today I wrote an entry about Sevin Rosen’s stated intent to stop raising venture funds because there were no good exits. Well, the timing couldn’t have been better. Today, Google announced the acquisition of YouTube for $1.6B in stock.
Another venture firm, Sequoia Capital, put $11.5M into YouTube for what was believed to be a 30% stake in the company. Let’s do the math, shall we? $1.6B x .3 = $480M. That’s not chump change and it constitutes a 40x return on investment. Not a bad day at the office.
Congrats to YouTube and to Google, I think both will benefit and prosper from the deal.
Ohio State’s 2006 record: 6-0 Next up: @Michigan State 10/14
Tune: Oh Mary by Neil Diamond
Technorati Tags: Google | YouTube | Acquisition | Mike Harding Blog
Energy
How does the US produce electricity?
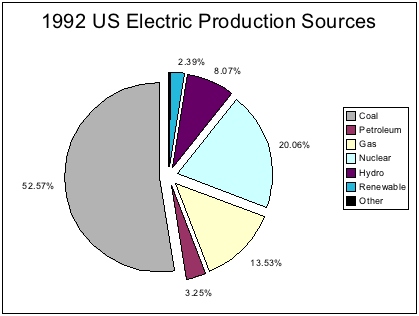
The answer is pretty straightforward, Coal, Liquid Petroleum, Petroleum Gases, Nuclear, Other, and Renewable (water, wind, sun, and biomass.) Of the renewable, water, or hydroelectric, is large enough to rate its own category. The reality of the situation is that in 1992 about 70% of our power was generated using fossil fuels, about 20% was generated using nuclear fuels, about 8% was generated using hydro, and everything else accounted for the remaining 2%. The absolute numbers for generation accounted for 3.08 Petawatt hours (PWh) at this time. See the chart below for a visual representation.

Data based on Electric Power Monthly Report
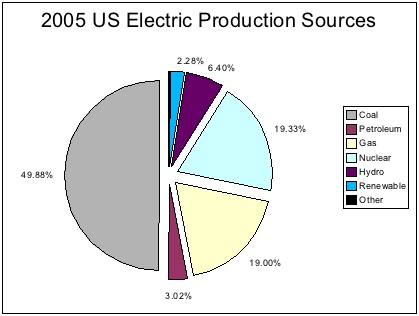
Flash forward 13 years to 2005. One might think that things have changed a great deal, but that’s not really the case. Look at the chart below to see the relative % of electricity generation by fuel source.

Data based on Electric Power Monthly Report
Our dependance on fossil fuels increased to 72%, with gas generation accounting for a large relative increase in % basis, but coal production on an absolute numbers basis increasing hugely as well from 1.62 PWh in 1992 to 2.01 PWh in 2005. Meanwhile, despite the fact that absolute PWhs increased for nuclear, hydro, and other renewables, the growth rate was insufficient to stave off a relative percentage share drop for each of these fuels with a relative change of -4% for nuclear fuel share, -21% for hyrdo fuel share, and -5% for other renewables. Yet over the 13 year period, nuclear power generated on an absolute basis increased from 0.62 PWh to 0.78PWh, hydro increased from 0.25 PWh to 0.26 PWh, and other renewables increased from 0.07 PWh to 0.09 PWh.
Obviously gas powered generation represents the largest change in this time period increasing from 84% from 0.42 PWh in 1992 to 0.77 PWh in 2005. Given the cost associated with the fuel, one has to wonder about this shift. Gas does have some advantages in that power plants can be constructed for around $800,000 per MW of generation and does burn significantly cleaner than the cleanest coal technologies. Overall, the number of PWh produced in 2005 was 4.04, an increase of 31% from 1992.
Some of you reading this are now rolling your eyes thinking “What does this all mean? And why should I care?”
It’s pretty simple really, despite the time and attention being focused on issues like air pollution, energy conservation, and foreign fuel dependence, we as a nation are failing to make progress. It’s hard to say that increasing our dependence on fossil fuels from 70% to 72% shows a trend in the right direction to help meet any of these challenges. There is an opportunity in front of us to grab hold of renewable energy and related technologies to change these observed trends such that the numbers are different in 10 years time. But we have to start now.
Ohio State’s 2006 record: 6-0 Next up: @Michigan State 10/14
Tune: The Power by Snap!
Technorati Tags: Electricity | Production | Energy | Mike Harding Blog
Innovation
VCs losing confidence
Your traditional venture capital (VC) firms, Sevin Rosen in this case, are finding it hard to deal with success and expectation. In this article, Sevin Rosen general partner Steve Dow talks about how the expected returns for new venture funds “ain’t gonna happen” and that’s why they’ve decided against raising $300M for new investment in the fund Sevin 10.
When the VCs lose faith, we’re in trouble. One trend I observe is that VCs have grown increasingly risk averse. That’s a bad thing in a fundamentally risk-based business. You never want to take stupid or uninformed risks, but it’s risk you’re taking make no mistake about it. I’ve wondered when the industry would restructure, maybe this is the start. Once VCs stopping making deals because they’re risky, the start-up world as we know it ceases to exist.
One thing is for sure, if more VCs take this course, our economy as we know it is doomed. Our whole basis for competition revolves around risk-based innovation. Meanwhile, if you’re shopping a deal, you know at least one firm to cross off the list.
Ohio State’s 2006 record: 6-0 Next up: @Michigan State 10/14
Tune: Losing my Religion by R.E.M.
Technorati Tags: Venture | Capital | Faith | Mike Harding Blog
« Previous Entries
» Next Entries


