Archive for November, 2007
Raft River one step closer
Via Yahoo News:
The plant originally commenced the test phase of power production on October 18th and operated over a six-day period until October 23rd, during which time it ran for 108 hours and generated a total of 1,022 gross megawatt-hours of electrical power. On October 21st the plant operated for 24 hours and produced a peak output of 13.2 megawatts. The first revenue from the test run has been received from Idaho Power Company.
The plant will now continue an approximate sixty to ninety-day start-up and testing phase during which time all generated electricity is being sold. Plant operations are being scheduled to allow for operator training, equipment testing and for Ormat Nevada Inc. to complete power plant performance testing and other completion obligations.
US Geothermal is keeping to its announced timing around the project, despite unforeseen problems, which is good news for investors.
Disclosure: The principals of MeV hold no position in US Geothermal.
Real Data about Conservation
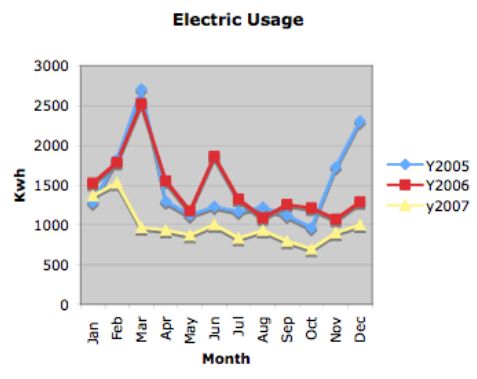
The chart above is from a family member’s home with data over the last 3 years. Of interest about this home, is that it is relatively new (<10 years old) and all-electric (water heating, cooking, clothes dryer, heating/cooling, etc.) Other interesting things to know is that the home has, relatively speaking, many windows and is located in an area where it is very warm in the summer and can get very cold in the winter.
Over the past 3 years this household has made a point of attempting to reduce their energy consumption and ultimately, energy efficient lighting has made a big difference as have solar shades to help with temperature control. One of the things that is striking about this chart is how the peaks have been reduced. Notice in March for 2005/2006 that the peak consumption was around 2,500 KWh. In 2007 that was reduced to about 1,000 KWh. Overall, the 2007 consumption is about 1/3 less than for comparable periods in the prior years.
Conservation does matter and when real data like this is exposed, it shows you what is possible by just by doing the simple things. 5 comments
Nuclear Battery
From the Santa Fe Reporter via StephenYears.com:
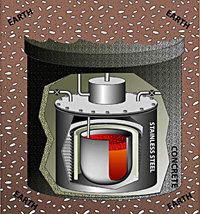
4 commentsThe portable nuclear reactor is the size of a hot tub. It’s shaped like a sake cup, filled with a uranium hydride core and surrounded by a hydrogen atmosphere. Encase it in concrete, truck it to a site, bury it underground, hook it up to a steam turbine and, voila, one would generate enough electricity to power a 25,000-home community for at least five years.
The company Hyperion Power Generation was formed last month to develop the nuclear fission reactor at Los Alamos National Laboratory and take it into the private sector. If all goes according to plan, Hyperion could have a factory in New Mexico by late 2012, and begin producing 4,000 of these
reactors.Though it would produce 27 megawatts worth of thermal energy, Hyperion doesn’t like to think of its product as a “reactor.†It’s self-contained, involves no moving parts and, therefore, doesn’t require a human operator.
“In fact, we prefer to call it a ‘drive’ or a ‘battery’ or a ‘module’ in that it’s so safe,†Hyperion spokeswoman Deborah Blackwell says. “Like you don’t open a double-A battery, you just plug [the reactor] in and it does its chemical thing inside of it. You don’t ever open it or mess with it.â€
Calpine Tanks
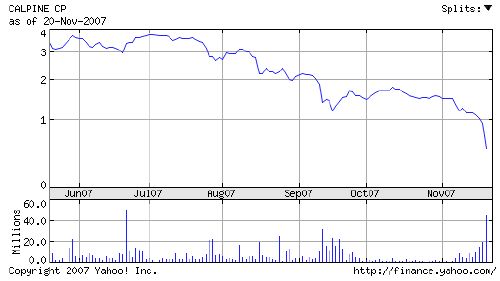
Back in June when Calpine unveiled their plan to emerge from bankruptcy, we weren’t too positive. In fact, we were downright puzzled by the market reaction sending the stock over $3/share and market capitalization greater than $1.5B. The issue has been on a steady downswing since that time settling in around $1.20/share, around $600M in market cap. Yesterday the bottom dropped out when the company announced a reduction in their enterprise value by $900M. The stock’s valuation now stands around $240M and closed yesterday at $0.495/share.
We wonder if it might not be a sensible thing for Calpine to spinoff its geothermal unit into a separate entity and let the natural gas portion of its portfolio sort itself out with the mother company. With the current market for renewable energy running very hot, this could create a pure play competitor to Ormat with 2x the generation capacity (Ormat is producing about $200M/year from ~375MW – Calpine has 800MW, that should produce around $425M in revenue per year…)
At current valuation and with the geothermal assets, we see Calpine as an interesting speculative buy. Caveat Emptor.
Disclosure: The author holds no position in Calpine stock. The author is considering a speculative, long-term position in the company. 2 comments
ITAIPU: 63.3 GWh and zero emissions
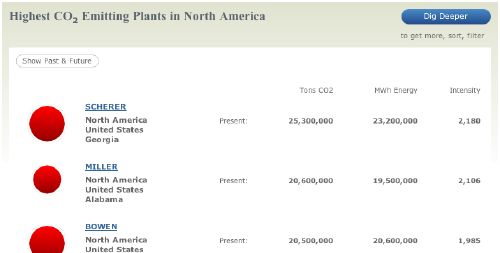
A few days ago the link for Carbon Monitoring for Action (CARMA) was forwarded along to us. This is a mashup of the global electric power plant database on a map with visual representation of the size of the plant, intensity, and carbon contribution plotted on the map, globally, by continent, by country, by region/state, etc. Take a look at a screen shot below:
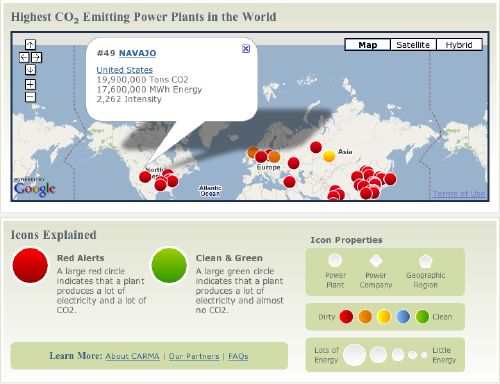
As you can see, the top 50 carbon emitters are plotted at a global level and #49 Navajo Power Plant is selected showing it produces 17.6 GWh of power along with 19.9 M tons of CO2 emissions per year. One of the more interesting things they track is intensity, or pounds of CO2 emitted per megawatt-hour of electricity produced.
The data in CARMA are compiled from numerous sources. Emissions data for thousands of power plants in the U.S., Canada, the EU, and India come from official reports. Other data are derived from information provided by power sector analysts, the International Energy Agency, the U.S. Department of Energy, the Environmental Protection Agency, and a host of geographic databases. So while it might not be 100% accurate, it’s credible and trackable and certainly better than what existed before.
The aggregations and zooming are very useful and it enables a researcher to determine not only the largest contributors to CO2 emissions, but also the most intense (or least efficient) as well as the lowest producers and most efficient power plants. One thing that may be surprising to people is that the largest electric power plants on the planet are also among the lowest CO2 emitters – gravity hyrdo-generation facilities. For instance, the largest plant on the planet is ITAIPU in Brazil, an 8 GW hydo facility producing over 63 GWh of power per year and zero CO2. In fact, of the 15 largest power plants globally (4 GW and over) – ten are zero CO2 emission.
If you’re interested in knowing more about power plants, their emissions, and impact, we encourage you to visit CARMA. Comments are off for this post