Archive for the 'Policy' Category
Needed: Smart Grid
Sorry to do this two days in a row, but Renewable Energy Access is on a roll. Today’s great content revolves around rebuilding the electrical grid.
1 commentCreating a 21st Century Grid
by Stephen Lacey, Staff WriterIn 1957, as Eisenhower began his second term as U.S. President, the first satellite launched into orbit and the first commercial nuclear reactor came online, electrical workers all over the country were installing the world’s most advanced transmission and distribution (T&D) system. Today, much of that T&D system installed 50 years ago remains in place, holding together a patchwork grid for ever-expanding electricity markets.
“You have to think much more distributed than centralized, you have to solve the problem of storing energy, and it has to be much more like an internet system than the current grid is today in order to be effective.”
Dr. Wade Adams, Director, Richard E. Smalley Institute for Nanoscale Science and Technology
Now in 2007 – the age of the internet, personal digital media and distributed energy — the grid has failed to keep pace with the rapidly changing technological landscape. While most industries rely on technologies that have been invented or updated in the last few years, the electricity delivery industry uses technologies that have more or less stayed the same for 100 years.
There’s a common idiom that goes, “if it ain’t broke don’t fix it.†While the grid in the U.S. is hardly broken, it is beginning to deteriorate rapidly in some places, and it will need some serious repairs in order to meet the growing demand for electricity in general and distributed renewable electricity specifically.
“We need to see a very substantial transformation of the system,†says David Meyer, Senior Policy Advisor in the Office of Electricity Delivery and Energy Reliability at the U.S. Department of Energy (DOE). “We’re outgrowing it in many parts of the nation. It’s certainly not the high-capacity, integrated and smart system that we need.â€
The current grid is a stiff arrangement of one-way transmission lines, centralized generation facilities and aging substations. The recent emergence of large amounts of renewable electricity in markets around the country are creating new challenges for both the transmission and distribution sectors.
Supply and Demand
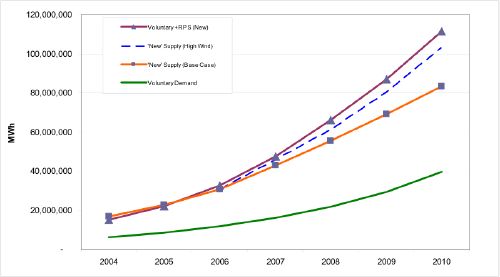
NREL published an interesting paper this month exploring the dynamics of renewable energy supply and demand. The conclusion of the report was demand, driven by fiat (renewable portfolio standard) and choice (voluntary renewable power supply) were likely to exceed supply by as much as 8,000,000 MWh by 2010.
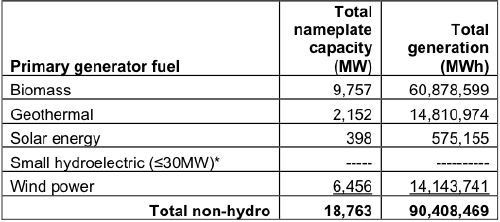
One other item of note, in the table below, you can see the impact of capacity factor. Note the nameplate installed MW of wind vs. the output of MWh. Then compare that to geothermal, you’ll see that significantly less nameplate capacity of geothermal leads to a disproportionate output of MWh. This is due to capacity factor.
DoE: 30 years and $350B later
This month marks the 30th birthday of the US Department of Energy. Formed in the aftermath of the 1970’s energy crisis, the Department was created to catalyze the transformation of the US from a net-oil importer and net-pollution exporter into a nation with a secure energy supply and sustainable environmental footprint while keeping the economy humming along and keeping energy prices stable for consumers. The 2007 version of the Department’s mission is:
- Energy Security
- Nuclear Security
- Scientific Discovery and Research
- Environmental Responsibility
- Management Excellence
While it’s clear there have been many accomplishments that the DoE can claim, relative to their mission, these are the results of the 30 year history:
- Energy Security – 1977, 77% of our electricty generated from fossil fuels and 46.5% of oil imported. 2007, 70% of our electricity generated from fossil fuels and 65.9% of oil imported.
- Nuclear Security – 1977, The US, USSR, UK, France, and China were nuclear powers. In 2007, India, Pakistan, Israel, North Korea, and perhaps Iran have entered the fraternity. Security has proven lax at national labratories and military bases. Nuclear electric power production has increased from 9% in 1977 to nearly 21% in 2007. Nuclear waste management issues are still unresolved and the problem continues to grow. There have been no nuclear attacks.
- Scientific Discovery and Research – Many interesting discoveries have been made; but the percentage of fossil fuel electricity generation, the nuclear waste issues, and oil import growth indicate that the breakthroughs are not making it to commercial application at a fast enough rate to make a difference.
- Environmental Responsibility – Renewable electrcity production has decreased in share from 14.3% in 1977 to 9% in 2007. CO2 levels have grown from ~335 parts per million in 1977 to >380 ppm at present.
- Management Excellence – Though it’s not quite clear what this means, the budget of the DoE was $6.3B in 1977 and has grown to $23.5B in 2007. The cumulative spend on the DoE from 1977 to present is estimated to be in excess of $350B.
Many dedicated and talented people work for the DoE, we’ve met them in our travels. However, we have to question the overall direction of the agency and its resources since the mission has not been accomplished. Compared with the levels 30 years ago, the US is more dependent than ever on foreign oil to sustain the demand for transportation fuel, the electricity industry produces a smaller percentage of renewable power, the level of greenhouse gases has increased nearly 10%, and nuclear weapons technology and capability have proliferated. However, the DoE’s budget has increased 4-fold over that same time horizon.
It’s time to closely examine our national priorities and align resources in a whole-hearted manner to achieve the necessary impacts. It’s one thing to have a mission posted on a web site, it’s another to allocate resources toward that mission and measure progress each day, week, month, and year toward achieving those goals.
Decision Time: Energy Investments
Recently, one of our partners brought an interesting situation to light. AMP-Ohio, a US electricity generation company, is working to build a new $2.7B, 1,000MW “clean coal” generation facility on the Ohio River. As part of the planning for this plant, the company is visiting the municipalities it serves and asking each for a 50 year commitment in the form of a power purchase agreement to aid in lining up the financing for the project. None of this is news, it’s happening every day across the country for every type of project.
The interesting bits of this story revolve around the tactics being employed by AMP to secure the commitments from the municipalities and ultimately, the choice these municipalities have in determining our energy future and policies.
A municipality involved in this is Yellow Springs, Ohio. A village of some 4,000 people located in southwestern Ohio. Historically, the village has been an independent where electricity is concerned, opting out of the large investor-owned utility Dayton Power and Light (now a subsidiary of DPLInc.) to maintain control over power production and distribution. AMP has created a sense of urgency around the project asking the municipalities to commit within a six month time frame or risk losing their AMP electrical supply when the current power purchase agreements expire in a few years. The leaders of the community are not experts on electricity generation and distribution (though there is expertise in the village staff and advisors) and are feeling the heat. In addition to the AMP proposal, the village is also struggling with issues around electricity distribution, but this is a separate issue from power supply.
As this topic heats up, there are editorials appearing and offers from groups like the National Resources Defense Council to come work with the village to understand its choices. This scene must be playing out in hundreds, if not thousands, of communities across the country. It comes down to a very real choice about how to proceed in the future: Why should communities invest in new fossil fuel projects with known negative impacts? Why not explore, and ultimately invest in, more reasonable and sustainable approaches? At $2.7M per megawatt of generation capacity in the proposed plant, why not look at resources like geothermal with the same baseload characteristics of a coal plant, and virtually none of the emissions? Averaged development cost per megawatt? $3M.
In a note written to the our partner who happens to reside in this village yesterday, some questions were posed that the village leadership should be considering:
- Has the village characterized its resource requirements/load? Has this been projected into the future?
- What is the net present value of the village’s aggregate power purchasing over a 50 year horizon?
- What conservation programs have been contemplated to affect the load over the longterm?
- What local renewable resources have been reviewed for feasibility of serving the electrical load?
Armed with this information, a community dialogue can then begin around the available choices and informed decisions based on information can be made. From a personal perspective, the simple act of installing compact fluorescent lamps in 87% of a home’s light fixtures has reduced electricity demand by 25%. That’s hard data, a story about it is available here. Small choices like this made across a community can have a large impact.
Regardless of where one stands on the environmental issues like global warming, green house gases, particulate air pollution, acid rain, etc. it is the country’s economic interest to not direct one more dollar toward development of new fossil fuel electricity generation. Now is the time, with each of these sorts of decisions at the local level, to assert our desire to responsibly and reasonably harvest renewable resources for our future power needs. This should be coupled with demand management and simple and effective conservation mechanisms that require minimal impact on end consumers. In this way, we can shape a better future for our families and minimize our negative impact on our environment.
Where does your community get electrical power? Are there decisions being taken by your local government? Now would be a good time to find out and make your voice heard. If people don’t speak out on these issues, the situation will not change.
New RPS States

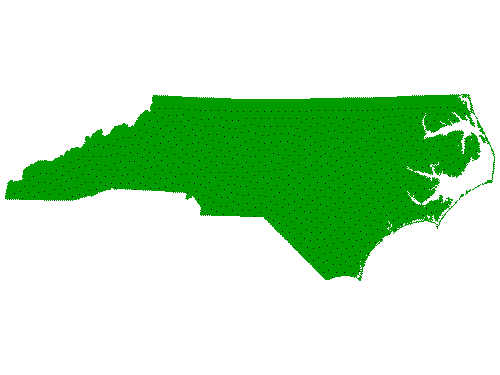
In the past few days, North Carolina and Illinois have joined the 21 other states (and the District of Columbia) in adopting renewable portfolio standards. The basic idea behind an RPS is that a certain percentage of electricity must be delivered by renewable resources within some time frame. The California RPS for instance dictates that 20% of the state’s electricity must come from renewable sources by 2010, presently it’s 14%. Utilities, Municipal Districts, and Direct Access providers are tasked with ensuring the percentage is met and will be fined $50 per MWh for non-compliance up to $25M per entity per year.
North Carolina’s RPS targets a 12.5% RPS by 2021. An interesting twist is that NC is looking to achieve 40% of that through conservation and efficiency. Illinois is a more standard RPS targeting 25% by 2025 with milestones along the way every few years. Comments are off for this post