Real Data about Conservation
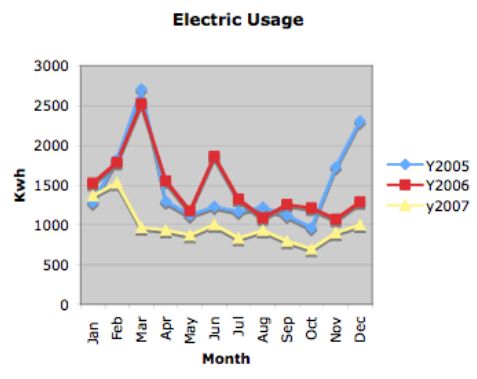
The chart above is from a family member’s home with data over the last 3 years. Of interest about this home, is that it is relatively new (<10 years old) and all-electric (water heating, cooking, clothes dryer, heating/cooling, etc.) Other interesting things to know is that the home has, relatively speaking, many windows and is located in an area where it is very warm in the summer and can get very cold in the winter.
Over the past 3 years this household has made a point of attempting to reduce their energy consumption and ultimately, energy efficient lighting has made a big difference as have solar shades to help with temperature control. One of the things that is striking about this chart is how the peaks have been reduced. Notice in March for 2005/2006 that the peak consumption was around 2,500 KWh. In 2007 that was reduced to about 1,000 KWh. Overall, the 2007 consumption is about 1/3 less than for comparable periods in the prior years.
Conservation does matter and when real data like this is exposed, it shows you what is possible by just by doing the simple things.


I spend my first 5 years in the energy conservation business and I have to say that this doesn’t look right. Not that one can’t make a big difference in one’s energy usage by paying attention to HVAC usage and lighting choices, but the oddly timed discontinuities defy reason. High usage in 12/05 followed by a plummet in 1/06? Those giant peaks in March are mystifying. There’s got to be some kind of unusual occupancy or other factors going on there.
Just my not-so-humble-opinion.
Bill
Bill,
This data was provided to me second-hand by a PhD mathematician and computer scientist. I take it at face value. Since the occupants are retired, I do know there are differences in occupancy etc. over the course of the data collection. The data (I presume) is from the electric bills so the data is skewed later than the actual consumption (i.e., March data point is February consumption – in an all electric heat situation and a cold February, I can easily see a spike occurring.)
I’ll ask the originator of the data if he wishes to comment on this thread.
Cheers,
mh
In response to Bill:
First I would differ a bit from mh’s analysis in that the interesting thing about the usage is that the overall trend, year round is down, maybe 20 per cent. The peaks are more complex and I don’t remember all the circumstances.
The house has a main floor with a loft and a finished basement. The house is passive solar with 45 windows of good quality, 30 that contribute to winter heating. The basement has electric heat. We are retired, live on an organic farm and produce and store much of our own food. The main floor has only a small propane stove that we use sparingly. There is no air conditioning in the main part of the house but we have a small air conditioner in the basement that we use as a dehumidifier. We have electric hot water heaters (2 as my wife has a skin condition that requires special shower water) and a freezer (part of the reduction was from removing an older freezer.) We have an electric well pump that is used in a business and is pretty much a constant user. The last two months on this year’s chart are estimates but my meter echoes the first of those two estimates.
The temperatures here in western NC mountains are moderate, with a large daily swing in temperature. Living in a passive solar house is a different experience from that of the usual thermostat controlled house. You live with the daily cycle. The house heats during the afternoon and stays warm in the evening. It cools at night and we prefer cool sleeping temperatures. The morning is the trouble period since it is cold when we get up. We turn on the propane stove and sometimes an additional electric heater during breakfast. If we use the basement then we may turn on the electric heat there. We also vent our electric dryer into the house in the winter saving the heat. (Summer we sometimes hang closes outside on a line.) This is probably more than you wanted to know about our lifestyle but it is very dependent on weather, clouds up our usage and we have a bit of choice on strategy for electric usage. We are affluent enough to pay our utility bills no matter how wasteful we are. We are also old enough (70) to want to be comfortable, temperature wise. So cutting usage is a matter of responsibility and we want to do it.
A recent project has been to install cellular blinds on all our windows and play the daily sun cycle more wisely. We open the blinds when the sun hits a window and close them otherwise. This increases the Rvalue for the windows about 60% and gives you a warmer skin feeling. The electric heaters have seen very little usage this fall. Our son, who lives in another house on the farm is installing a solar water heater and if that does well we will do that also.
These are modest steps but they are ones that cost little and can be done in newer houses in this area of the country.
Regards and I’m sorry I can’t give specific reasons for the particular points you questioned.
Thanks for the detailed comment Bob. The clarification will certainly help deepen the understanding of the data.
Robert – Thanks for helping me to get my head around this. I am still puzzled as to what was happening in Feb/Mar of 05 and 06 that didn’t happen in 07?
Cutting energy use by 66% year over year in that period doesn’t just happen. It suggests something both dramatic and memorable. Do you know what that might be?
Thanks for your contributions.
Bill