Blog Archives
What is the environmental cost of a Megawatt hour?
In previous entries we’ve discussed how much electricity the US is producing and consuming, what the sources of generation are, and how much it costs from a monetary perspective. But there are other costs.
This entry will focus on the largest fuel source for electricity generation, coal. This is an ancient source that is well understood and drives a massive supply chain from real estate with mineral rights clear through mining and transportation and finally ending up in places like electricity generation. Without a doubt the technology for oxidizing (burning) coal to create heat which in turn is transferred to liquids which through phase change from liquid to gas pressurize and then drive turbines attached to generators, has improved dramatically. Back during the early days of the industrial revolution cities like Pittsburgh were covered in smog and soot.
The state of the art today is that approximately 1,000 kg (~2,200 lbs) of carbon dioxide and approximately 13kg of sulfur dioxide and nitrogen oxides are emitted into the atmosphere for each MWh of power generated by burning coal. As is well known, carbon dioxide is a major contributor to global warming and the sulfur and nitrogen oxides are key ingredients to acid rain. This level of emissions is a vast improvement from the late 19th century, but still constitutes a problem. With 5% of the population of the earth, the US is responsible for 23% of carbon dioxide emissions on the planet (not just electricity generation, transportation has alot to do with that number as well.) (Source: US Environmental Protection Agency.)
One of the key challenges in limiting emissions is the increasing demand for electricity. Right now, the demand is outstripping the new cleaner generation technology’s installation rate which means that older, less efficient, more polluting coal generation plants are staying in production longer than is desirable. Each time a new technology (be it natural gas or photovoltaics) is deployed, it either meets new demand or displaces older, less cost effective generation technologies. Given the increasing cost of fossil fuels, there is an opportunity to focus our attention more completely on the installation of renewable electric generation at a scale that makes the economics attractive in addition to exceeding the growth in electricity demand. That could have the effect of displacing less effective generation technologies and as a side effect, limit harmful emissions.
Technorati Tags: Energy | Pollution | Emissions
Fossil fuel costs for electric generation
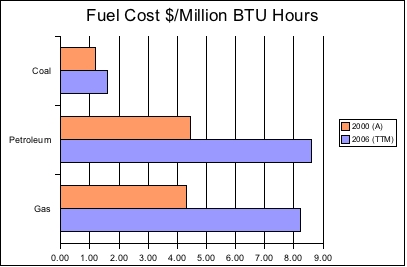
Data based on Electric Power Monthly Report
As you can see from the graph above, fuel prices have increased rather dramatically for petroleum and natural gas over the past 6 years. It is worth noting that the 2000 numbers are actual average prices (A) and the 2006 numbers are a trailing twelve month average (TTM.) Even coal, not known for price volatility has increased in price 35% during this time period. Petroleum and gas have increased 95% and 91% respectively in the same time period. As previously noted in this entry, coal, petroleum, and gas accounted for 72% of electric power generation in 2005 with coal accounting for the large majority of generation. Gas accounts for 19% of total generation, up 84% from 1992. Petroleum accounts for 3% of generation.
A fair question would be, what has happened to retail prices of electricity during this same period?
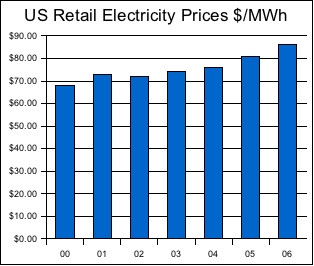
Data based on Electric Power Monthly Report
As you can see, retail prices have increased during this same time period, but not close to the rate of increase of fossil fuel cost. Does this mean electric generation companies are going out of business? Rising costs without a commensurate increase in end product cost tends to affect profit in a negative way. One thing is certain, it will be challenging to maintain a competitive business model when fuel costs are a major component of the cost of goods sold. Couple that with increasing regulatory pressures over emissions from oxidizing such fuels setup an interesting challenge for the power generation industry.
Technorati Tags: Electricity | Fossil Fuel | Energy Cost
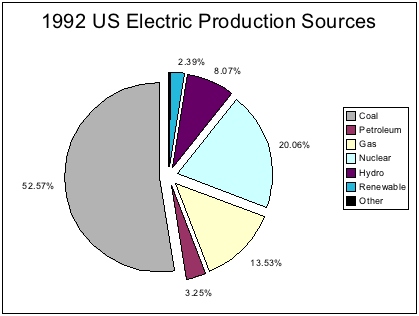
How does the US Produce electricity?
The answer is pretty straightforward, Coal, Liquid Petroleum, Petroleum Gases, Nuclear, Other, and Renewable (water, wind, sun, and biomass.) Of the renewable, water, or hydroelectric, is large enough to rate its own category. The reality of the situation is that in 1992 about 70% of our power was generated using fossil fuels, about 20% was generated using nuclear fuels, about 8% was generated using hydro, and everything else accounted for the remaining 2%. The absolute numbers for generation accounted for 3.08 Petawatt hours (PWh) at this time. See the chart below for a visual representation.
             Â
Data based on Electric Power Monthly Report
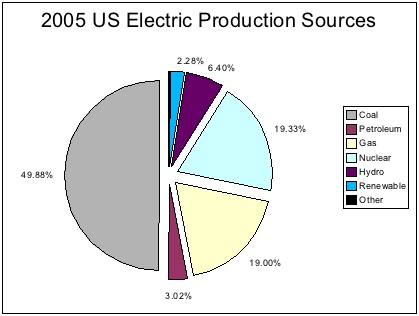
Flash forward 13 years to 2005. One might think that things have changed a great deal, but that’s not really the case. Look at the chart below to see the relative % of electricity generation by fuel source.
             Â
Data based on Electric Power Monthly Report
Our dependance on fossil fuels increased to 72%, with gas generation accounting for a large relative increase in % basis, but coal production on an absolute numbers basis increasing hugely as well from 1.62 PWh in 1992 to 2.01 PWh in 2005. Meanwhile, despite the fact that absolute PWhs increased for nuclear, hydro, and other renewables, the growth rate was insufficient to stave off a relative percentage share drop for each of these fuels with a relative change of -4% for nuclear fuel share, -21% for hyrdo fuel share, and -5% for other renewables. Yet over the 13 year period, nuclear power generated on an absolute basis increased from 0.62 PWh to 0.78PWh, hydro increased from 0.25 PWh to 0.26 PWh, and other renewables increased from 0.07 PWh to 0.09 PWh.
Obviously gas powered generation represents the largest change in this time period increasing from 84% from 0.42 PWh in 1992 to 0.77 PWh in 2005. Given the cost associated with the fuel, one has to wonder about this shift. Gas does have some advantages in that power plants can be constructed for around $800,000 per MW of generation and does burn significantly cleaner than the cleanest coal technologies. Overall, the number of PWh produced in 2005 was 4.04, an increase of 31% from 1992.
Some of you reading this are now rolling your eyes thinking “What does this all mean? And why should I care?”
It’s pretty simple really, despite the time and attention being focused on issues like air pollution, energy conservation, and foreign fuel dependence, we as a nation are failing to make progress. It’s hard to say that increasing our dependence on fossil fuels from 70% to 72% shows a trend in the right direction to help meet any of these challenges. There is an opportunity in front of us to grab hold of renewable energy and related technologies to change these observed trends such that the numbers are different in 10 years time. But we have to start now.
Technorati Tags: Electricity | Production | Energy
US Energy Consumption
Do you think, over the next 10 years, that US electricity consumption will increase or decrease?
An interesting question, there are constant conservation programs and there is ever improving technology (like Sun’s Ultra T1 processor,) but do you think that’s enough to offset any increase in demand?
Sometimes a historical look can be illuminating when attempting to answer these sorts of questions. The chart below shows in Petawatt hours (a petawatt is 1,000,000,000,000,000 watts) how electricity production has grown since 1992 in the US. For our international readers, I apologize, I’m not taking a global position on this, only a US-centric position. Well, frankly, because I live here and it’s big enough to be undigestable with the US alone. Notice that there is an aggregate increase of nearly a petawatt hour in the amount of electricity consumed over the past 13 years.
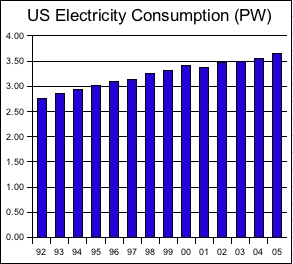
Data based on Electric Power Monthly Report
A percentage view of electricity consumption over time shows the growth is assuredly not linear. From 1992 to 2005 the aggregate growth in electricity consumption is 32.4%. There does seem to be a correlation between electricity consumption and the overall health of the economy. Note the relatively high growth rate in 1999 (Dotcom bubble) and the negative growth rate in 2001 (post bubble, 9/11) – both of these years vary considerably from the average annual growth rate of 2.2%. It is also interesting to note that the growth rate in 2005 is 3.1%, the fourth highest percentage in the measurement period. Which begs the question, are we in the midst of another bubble?
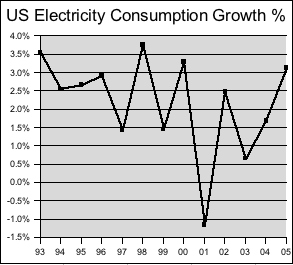
Data based on Electric Power Monthly Report
Returning to the questions above, will demand for electricity increase or decrease and what, if any impact with conservation and technology have on the trend, I believe we’ll continue to see an increase in demand. Even a fraction of a % of growth in demand spurs the need for more energy generation. And that’s interesting.
Technorati Tags: Electricity | Consumption | Energy
What is green and fast?
Audi R10 Racing Diesel

When Rudolf Diesel patented his compression engine (air is compressed, the temperature rises, fuel is injected and ignites without a spark) I doubt he ever envisioned cars like the Audi above. The current generation of diesels are powerful and increasingly green as their emissions are treated. Combine that with Biodiesel fuel, and you’ve got a winning combination. Here’s an interesting article about this topic.
Technorati Tags: Diesel | Racing | Biodiesel