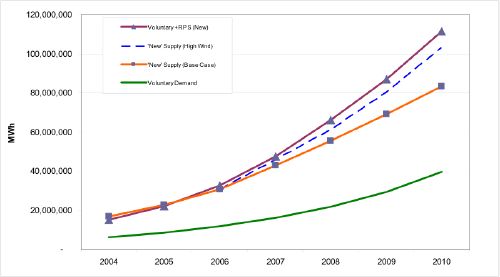
NREL published an interesting paper this month exploring the dynamics of renewable energy supply and demand. The conclusion of the report was demand, driven by fiat (renewable portfolio standard) and choice (voluntary renewable power supply) were likely to exceed supply by as much as 8,000,000 MWh by 2010.
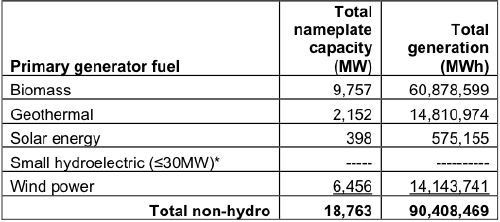
One other item of note, in the table below, you can see the impact of capacity factor. Note the nameplate installed MW of wind vs. the output of MWh. Then compare that to geothermal, you’ll see that significantly less nameplate capacity of geothermal leads to a disproportionate output of MWh. This is due to capacity factor.