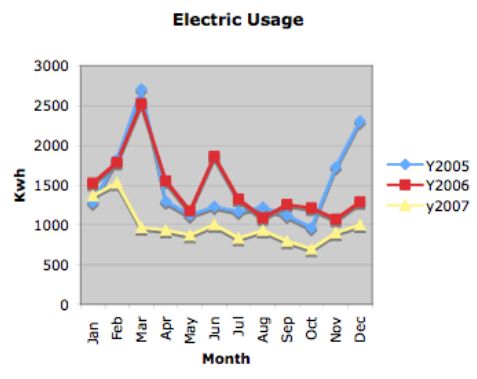
The chart above is from a family member’s home with data over the last 3 years. Of interest about this home, is that it is relatively new (<10 years old) and all-electric (water heating, cooking, clothes dryer, heating/cooling, etc.) Other interesting things to know is that the home has, relatively speaking, many windows and is located in an area where it is very warm in the summer and can get very cold in the winter.
Over the past 3 years this household has made a point of attempting to reduce their energy consumption and ultimately, energy efficient lighting has made a big difference as have solar shades to help with temperature control. One of the things that is striking about this chart is how the peaks have been reduced. Notice in March for 2005/2006 that the peak consumption was around 2,500 KWh. In 2007 that was reduced to about 1,000 KWh. Overall, the 2007 consumption is about 1/3 less than for comparable periods in the prior years.
Conservation does matter and when real data like this is exposed, it shows you what is possible by just by doing the simple things. Tweet


Hey Mike,
That’s a real good example of how we all could help lower carbon emissions as responsible citizens of the good old USA. I’m inspirited to change all of the light bulbs in my home now. Do you know anything about heating a home with light bulbs? I’ve seen some articles about it, but don’t believe the results.