The answer is pretty straightforward, Coal, Liquid Petroleum, Petroleum Gases, Nuclear, Other, and Renewable (water, wind, sun, and biomass.) Of the renewable, water, or hydroelectric, is large enough to rate its own category. The reality of the situation is that in 1992 about 70% of our power was generated using fossil fuels, about 20% was generated using nuclear fuels, about 8% was generated using hydro, and everything else accounted for the remaining 2%. The absolute numbers for generation accounted for 3.08 Petawatt hours (PWh) at this time. See the chart below for a visual representation.
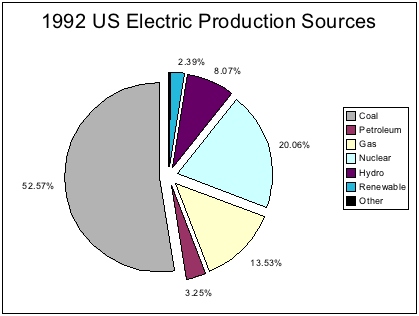
Data based on Electric Power Monthly Report
Flash forward 13 years to 2005. One might think that things have changed a great deal, but that’s not really the case. Look at the chart below to see the relative % of electricity generation by fuel source.
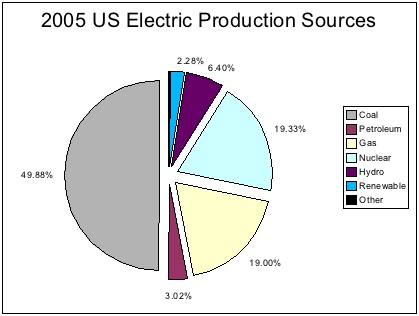
Data based on Electric Power Monthly Report
Our dependance on fossil fuels increased to 72%, with gas generation accounting for a large relative increase in % basis, but coal production on an absolute numbers basis increasing hugely as well from 1.62 PWh in 1992 to 2.01 PWh in 2005. Meanwhile, despite the fact that absolute PWhs increased for nuclear, hydro, and other renewables, the growth rate was insufficient to stave off a relative percentage share drop for each of these fuels with a relative change of -4% for nuclear fuel share, -21% for hyrdo fuel share, and -5% for other renewables. Yet over the 13 year period, nuclear power generated on an absolute basis increased from 0.62 PWh to 0.78PWh, hydro increased from 0.25 PWh to 0.26 PWh, and other renewables increased from 0.07 PWh to 0.09 PWh.
Obviously gas powered generation represents the largest change in this time period increasing from 84% from 0.42 PWh in 1992 to 0.77 PWh in 2005. Given the cost associated with the fuel, one has to wonder about this shift. Gas does have some advantages in that power plants can be constructed for around $800,000 per MW of generation and does burn significantly cleaner than the cleanest coal technologies. Overall, the number of PWh produced in 2005 was 4.04, an increase of 31% from 1992.
Some of you reading this are now rolling your eyes thinking “What does this all mean? And why should I care?”
It’s pretty simple really, despite the time and attention being focused on issues like air pollution, energy conservation, and foreign fuel dependence, we as a nation are failing to make progress. It’s hard to say that increasing our dependence on fossil fuels from 70% to 72% shows a trend in the right direction to help meet any of these challenges. There is an opportunity in front of us to grab hold of renewable energy and related technologies to change these observed trends such that the numbers are different in 10 years time. But we have to start now.
Ohio State’s 2006 record: 6-0 Next up: @Michigan State 10/14
Tune: The Power by Snap!
Technorati Tags: Electricity | Production | Energy | Mike Harding Blog
« VCs losing confidence
» 480 million reasons to take a risk
Energy
How does the US produce electricity?
10.09.06 | Comment?


« VCs losing confidence
» 480 million reasons to take a risk
Musings from the Coast


comments
recent
- The Art of Being Cheap in Business
- The REAL Fiscal Cliff
- Plan for 2013
- Goodbye Gracie
- Our First Holiday Season as a Retailer
Categories
- Business (252)
- Coastal Stuff (124)
- Commentary (200)
- Energy (256)
- Humor (314)
- Innovation (277)
- Media (144)
- Oddyssea (52)
- Politics (245)
- Religion (80)
- Sports (170)
- Ohio State Football (136)
- Technology & Science (162)
- Travel (106)
Links
- Buckeye View
- Coastsider
- Freedom From Religion Foundation
- Half Moon Bay Buoy
- Half Moon Bay Review
- Information Arbitrage
- Loud Thoughts
- Oddyssea
- Stephen Years dot Com